Cryptocurrency trading is becoming increasingly popular, and with it, the need to understand how to read crypto charts. Cryptocurrency charts provide traders with a visual representation of the price movements of a particular cryptocurrency. By understanding how to read crypto charts, traders can make informed decisions about when to buy and sell their digital assets. This beginner’s guide to understanding cryptocurrency price movements will provide an overview of the different types of crypto charts, how to interpret them, and how to use them to make informed trading decisions.
Types of Crypto Charts
Crypto charts come in a variety of forms, each providing different information about the price movements of a particular cryptocurrency. The most common types of crypto charts are line charts, bar charts, and candlestick charts.
Line Charts
Line charts are the simplest type of crypto chart. They show the price of a cryptocurrency over a period of time, with each point on the chart representing the closing price of the cryptocurrency at a given time. Line charts are useful for seeing the overall trend of a cryptocurrency’s price movements.
Bar Charts
Bar charts are similar to line charts, but they provide more information. Each bar on the chart represents the opening, closing, high, and low prices of a cryptocurrency over a period of time. Bar charts are useful for seeing the range of a cryptocurrency’s price movements over a period of time.
Candlestick Charts
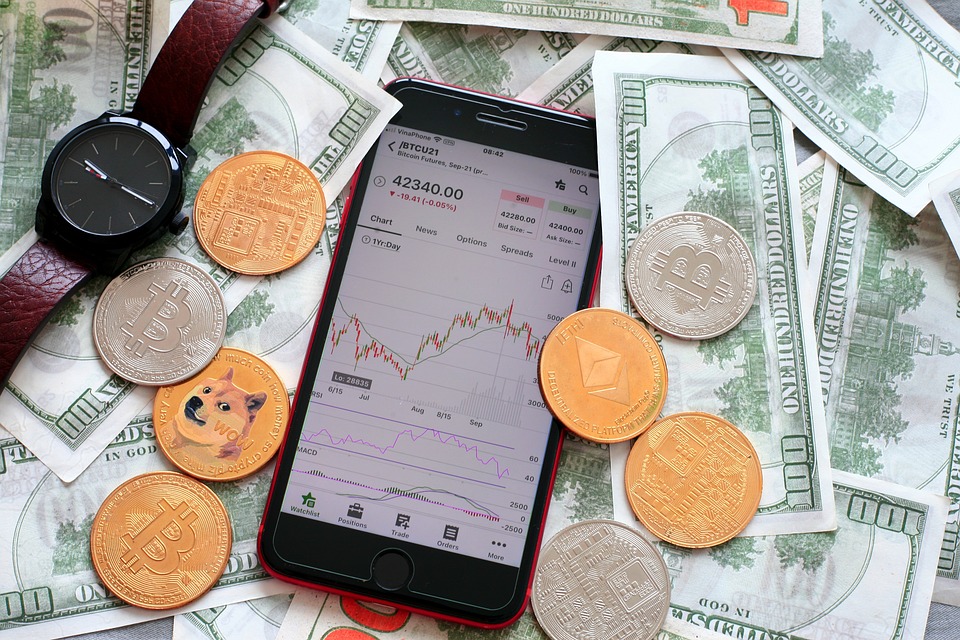
Candlestick charts are the most popular type of crypto chart. They provide the same information as bar charts, but they are more visually appealing. Each candlestick on the chart represents the opening, closing, high, and low prices of a cryptocurrency over a period of time. Candlestick charts are useful for seeing the range of a cryptocurrency’s price movements over a period of time, as well as for identifying patterns in the price movements.
How to Read Crypto Charts
Now that you know the different types of crypto charts, it’s time to learn how to read them. Crypto charts provide traders with a visual representation of the price movements of a particular cryptocurrency. By understanding how to read crypto charts, traders can make informed decisions about when to buy and sell their digital assets.
Identifying Trends
The first step in reading crypto charts is to identify the overall trend of the cryptocurrency’s price movements. This can be done by looking at the line or candlestick chart and seeing if the price is generally increasing or decreasing over time. If the price is generally increasing, then the trend is said to be “bullish”. If the price is generally decreasing, then the trend is said to be “bearish”.
Identifying Support and Resistance Levels
The next step in reading crypto charts is to identify support and resistance levels. Support and resistance levels are points on the chart where the price of a cryptocurrency has difficulty breaking through. If the price of a cryptocurrency is approaching a support level, then it is likely to bounce back up. If the price of a cryptocurrency is approaching a resistance level, then it is likely to fall back down.
Identifying Patterns
The final step in reading crypto charts is to identify patterns in the price movements. Patterns can be used to predict future price movements. Common patterns include head and shoulders, double tops and bottoms, and triangles. By identifying patterns in the price movements, traders can make informed decisions about when to buy and sell their digital assets.
How to Use Crypto Charts
Now that you know how to read crypto charts, it’s time to learn how to use them. Crypto charts can be used to make informed trading decisions. By understanding the overall trend of a cryptocurrency’s price movements, identifying support and resistance levels, and identifying patterns in the price movements, traders can make informed decisions about when to buy and sell their digital assets.
How-To and Advices
How to Read Crypto Charts
1. Identify the overall trend of the cryptocurrency’s price movements.
2. Identify support and resistance levels.
3. Identify patterns in the price movements.
Advices for Using Crypto Charts
1. Use multiple types of crypto charts to get a better understanding of the price movements.
2. Be aware of news and events that could affect the price of a cryptocurrency.
3. Use stop-loss orders to limit your losses.
4. Don’t invest more than you can afford to lose.
Conclusion
Cryptocurrency trading is becoming increasingly popular, and with it, the need to understand how to read crypto charts. Crypto charts provide traders with a visual representation of the price movements of a particular cryptocurrency. By understanding how to read crypto charts, traders can make informed decisions about when to buy and sell their digital assets. This beginner’s guide to understanding cryptocurrency price movements has provided an overview of the different types of crypto charts, how to interpret them, and how to use them to make informed trading decisions.
#ChatGPT assisted in the creation of this article.